Dynamic Distribution for Inactive Genes in Telephone Model
ZHUChunjuan1,2, GUOYing2, LIANGYiqi2, JIAOFeng2,*
DOI: 10.48014/fcpm.20221110001
引用格式:
文章类型: 研究性论文
收稿日期: 2022-11-11
接收日期: 2023-03-15
出版日期: 2023-06-28
0 Introduction
All living things in the world,including ourselves,are made of cells.Genes are genetically significant fragments of DNA,which are functional and structural units of genetic materials.In generally,gene expression mainly consists of two processes:transcription and translation.Transcription refers to the process of transferring genetic information from DNA to messenger RNA(mRNA)under the action of RNA polymerase by taking DNA as a template and following the principle of base complementary pairing.mRNA is responsible for the storage and transfer of genetic information.It is translated into the final production proteins.
Almost the functions of all cell work depend on proteins,and the type and quantity of proteins in each cell is mainly determined by gene transcription.Gene transcription is the central part of life process and has been a hot topic in life science research for many years.
Only a few decades ago,scientists were used to observing the reaction processes of multiple cells in a unified way because of the limitations of traditional methods such as Microarray and RNA blotting.These experiments assume implicitly that cells with identical genes have the same cellular function in the same living environment.The experimental data obtained by these means tend to lead people to believe that gene expression is a continuous and definite process.With the development of many advanced detection technologies such as computer image processing and fluorescent protein technology in the early 20th century,researchers could observe the multiple key processes in a single cell in real time.The results of these experiments explained that gene expression is a discontinuous and random process.
In order to express the randomness of gene transcription,scientists used mathematical models to describe the randomness of gene transcription,and applied modern mathematical models combined with mathematical experimental data to explore the internal dynamics of biological organisms.In the mathematical models,there are a variety of quantitative indexes,such as mean,noise and probability of distribution[1-3].From the observations of the gene transcription experiments in single cells,biologists can estimate the numbers of the same kind mRNA in a cell accurately.In conjunction with statistical methods,biologists have been able to obtain a lot of data of the distribution about the number of mRNA under different experimental conditions.The theoretical study of these models can not only provide reasonable interpretation of the existing experimental data,but also help us to further understand the mechanism and root cause of the generation and reduction of random phenomena of gene expression.Gene transcription is the first and most important step of gene expression.Therefore,the study of the internal relationship between the number of mRNA production and the random behavior of gene transcription can help us to deeply understand the origin of the randomness of gene expression and further explore the regulation of the overall level of gene expression by the random process in the gene transcription system.
The distribution of mRNA is usually depicted by the probability mass function Pm(t)which determined by the system parameters of the models and it means the probability that there are exactly m mRNA molecules of the gene of our concern at time t in one cell.Researchers usually let it describe the number of mRNA,and it can best describe the randomness of gene expression [4-6].We express it by the reverse calculation of the generating function V(z,t).
In recent years,the accumulation of more and more experimental data and the innovation of theoretical methods provide new ideas for us to systematically establish and improve the mathematical model of random gene expression.The theoretical study of these patterns can not only provide reasonable interpretation of the existing experimental data,but also help us to further understand the mechanism and root cause of the generation and reduction of random phenomena of gene expression.
It is generally believed that the randomness of the production of gene transcripts comes from the random alternation between the two states of gene on and gene off,and the behavior of the synthesis and the degradation of mRNA at the state of gene on.The telegraph model is one of the classic models,and because of its simplicity and generality,it is considered as the standard model for studying random gene transcription.The diagram is as the following
gene off gene on
 mRNA
mRNA Ø,(1.1)
the gene switches randomly between off and on states[7],where kon and koff are the activation and the inactivation rate respectively.The synthesis rate vm > 0 and the degradation rate kδ > 0 are the birth and the death of mRNAs,respectively.Recently,we obtained lots of data on the histogram of Pm(t)[8-11],and many researchers have studied the distribution profiles of Pm(t)in [4,6,12-14,16].Theoretical analysis shows that there are only three types of distributions in the telegraph model:decreasing,unimodal and bimodal distribution,and there is a relatively simple correspondence between distribution types and system parameters.
We denote the respective probabilities of  mRNA molecules existing at time
  as
as  at inactive state and
  at active state.Let
and we can calculate and
 (1.2)
(1.2)
(1.3)
here  .Define
 (1.4)
(1.4)
Introduce the probability generating functions[15]
 (1.5)
(1.5)
Then we transform the equations(1.2)、(1.3)as the following
 (1.6)
(1.6)
 (1.7)
(1.7)
 (1.8)
(1.8)
 (1.9)
(1.9)
Solve the equations(1.6)—(1.8), is obtained:
 (1.10)
where  and
and  .Denote
 (1.11)
Recently,Jiao et al.[17] expressed as simple mathematical functions:
 (1.12)
for  ,and
,and
(1.13)
for .
.
In this paper,we continue to research the transcription in the telephone model and use the mathematics formulas of in [17] to discuss the dynamical distribution of inactive genes in telephone model.
1 Dynamical distribution of inactive genes
If  is appropriately small(e.g.
 ),we can prove that
  ,
, easily.Therefore,we will focus on the case where the synthesis rate of mRNA is relatively large.The next results show that if genes are easy to be at off state,then they are unlikely to be activated.And we find that no matter how much mRNA is generated,the dynamical distribution is decaying in that condition.The result that the decaying dynamical distribution in the translation system with genes are not be easily activated supports the observation that Raj found in mammalian cells[18].
Theorem 1.Let koff=kδ.∀t>0,if kon≤kδ,then the dynamical distribution is decaying.Furthermore,if kon=koff=kδ,and vm is appropriately large,Pm(t) peaks at m=0,and then the dynamic is horizontal for the beginning region at m≥1.In addition,Pm(t) will changes its concavity twice:if vm>3kδ /2,the concavity of the curves of Pm(t) is from concave up to concave down;if vm>3kδ/
 ,the concavity is from concave down to concave up at m=[
 (1-
(1- )-1].Here [.] represents the rounding symbol.Especially,if vm≥2kδ,the curves only have one infection point(from concave up to concave down);if vm<2kδ,the curves at steady state are always concave up.
Proof.When ,according(1.13),when  ,we can calculate directly that
 (2.1)
(2.1)
In addition,we can also estimate in another way.By using integration by parts,we reformulate
Because the last part of the above equation is .By introducing the new variable
 (2.2)
(2.2)
We can get a useful expression
 (2.3)
(2.3)
According(1.13)and(2.3),we have
 (2.4)
(2.4)
and when  ,we obtain
 (2.5)
(2.5)
When  ,according(2.4)and(2.5),we have
  .This means we can obtain the decaying distribution of mRNA at any time.
Moreover,if,then(2.4)and(2.5)can be reduced respectively as
 (2.6)
(2.6)
and
 (2.7)
(2.7)
Note that when  is large enough and in the finite region of ,we have
This means if is appropriately large,we can always see the decaying distribution and then the dynamic is almost horizontal for the beginning region at .
In addition,(2.6)and(2.7)mean that
 (2.8)
(2.8)
and when  ,
,
 (2.9)
(2.9)
We first analysis the concavity of the curves in the region about  .Take the derivative of(2.8)with respect to ,we get the unique minimum point of the equation(2.8)
 .Substitute this minimum point into(2.8)and note that
  ,we have
  .This means the concavity of the distribution curves is concave up.
When and  ,according(2.9),it is easy to verify that the sign of
  is changed at
  .Therefore,the distribution only has one infection point
  when .
In particular,(2.8)are(2.9)reduced as the following at the steady state
this shows if  ,the distribution curves are from concave down to concave up at the unique inflection point
  at the steady state,while when
  ,the distribution curves always keep concave down.
Theorem 2.Suppose  ,if
,if  then decays monotonically about
Proof.When ,we rewrite as the following forms by applying(1.12)
 (2.10)
Take partial integration to  ,we have
Note the expression of in(1.12),we can further simplify the above equation as
 (2.11)
Apply mean value theorem of integrals and combine the expression of in(1.12),we can use to express the last term of the above equation
 (2.12)
where  ,which is depended on
  and
and  .Therefore,we substitute(2.12)into(2.11)and finally get
 (2.13)
where .It is obviously if  ,the right-hand side of(2.13)is greater than 0.This shows
  .The theorem 2 is prove.
2 Numerical simulations
We use numerical simulations to demonstrate the above theorems.
Example 3.1 Assume  and
and  .We see decaying distributions at
  and steady state in figure 1.This supports the result in Theorem 2.1.
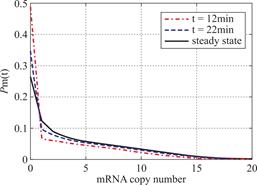
Fig.1 For genes that are not easily activated,we describe the change of the profile of Pm(t)about the number of mRNA m at different time according(1.13)at the condition kon=kδ = 0.05min-1 .Define vm = 2min-1, koff = 0.15min-1 .As shown in the figure,we see decaying distributions at t = 12,22 min and steady state.
Example 3.2 Assume  and
and  .In figure 2,we see decaying distributions and almost horizontal distribution curves for the beginning region at and steady state.This also supports the result in Theorem 2.1.
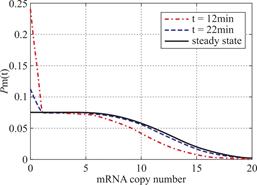
Fig.2 We describe the change of the profile of Pm(t)about the number of mRNA m at different time according(1.13)at the condition kon=koff=kδ=0.15min-1 .Define vm=2min-1 .As shown in the figure,we see decaying distributions and almost horizontal distribution curves for the beginning region at t=12,22min and steady state.
Example 3.3 Assume and  .We see decaying distributions at and steady state in figure 3 .This supports the result in Theorem 2.2.
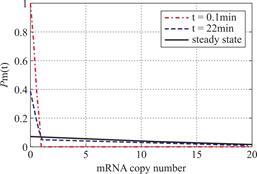
Fig.3 When genes are easy at off state,we describe the change of the profile of Pm(t)about the number of mRNA m at different time according(1.12).We let kon = kδ = 0.05min-1,vm=2min-1 .Define koff = 0.07min-1, that means genes are easy to get back off state.As shown in the figure,we see decaying distributions at t = 0.1,22 min and steady state.
3 Conclusion
In this work,we research the dynamics of inactive genes in two conditions for telegraph model.We prove that the dynamical distribution is always decaying for the inactive genes.Furthermore,if  ,and is appropriately large, peaks at
  ,and then the dynamic is horizontal for the beginning region at .
If genes are not easy to be activate( and
and  ),theorem 1 and theorem 2 show that the decaying distribution in the telephone model is usually not determined by the numbers of mRNA,but often determined by the average durations at off state.In fact,for the transcriptional systems of most higher organisms,genes are more likely to be at off state.Therefore,our theoretical results reflect the changes in the ability of its transcriptional mechanism to regulate the mRNA distribution in some extent about the process of the evolution of organisms.This decaying distribution during the process of transcriptional of inactive genes also supports the experimental results in mammalian cells[18].In the reference[18],they found that the distribution of the number of the transcripts is decaying with a longer tail.A longer tail means that a larger number of mRNA molecules are generated during transcription,but because genes in mammalian cells are not easily activated,so it results a decreasing distribution of mRNA numbers.
4 Acknowledgements
This work is supported by the National Natural Science Foundation of China(Nos.12101148,11871174),’Climbing’ Program(No.pdjh2023b0840)and the Project of Guangdong Construction Polytechnic(No.ZD2020-02).
Conflict of interest:The authors declare no conflict of interest.
[①] *通讯作者 Corresponding author:焦锋,jf1704@163.com
收稿日期:2022-11-11; 录用日期:2023-03-15; 发表日期:2023-06-28
参考文献(References)
[1] Jones D, Brewster R, Phillips R. Promoter architecture dictates cell-to-cell variability in gene expression[J]. Science, 2014, 346.
https://dx.doi.org/10.1126/science.1255301
[2] Sanchez A, Choubey S, Kondev J. Stochastic models of transcription: From single molecules to single cells[J]. Methods, 2013, 62: 13-25.
https://dx.doi.org/10.1016/j.ymeth.2013.03.026
[3] Zhou T, Zhang J. Analytical results for a multistate gene model[J]. SIAM J Appl Math, 2012, 72: 789-818.
https://dx.doi.org/10.1137/110852887
[4] Chen J, Jiao F. A novel approach for calculating exact forms of mRNA distribution in single-cell measurements[J]. Mathematics, 2022, 10: 27.
https://dx.doi.org/10.3390/math10010027
[5] Sun Q, Cai Z, Zhu C. A novel dynamical regulation of mRNA distribution by cross-talking pathways[J]. Mathematics, 2022, 10: 1515.
https://dx.doi.org/10.3390/math10091515
[6] Zhu C, Han G, and Jiao F. Dynamical regulation of mRNA distribution by cross-talking signaling pathways[J]. Complexity, 2020: 64026703.
https://dx.doi.org/10.1155/2020/6402703
[7] Larson D R. What do expression dynamics tell us about the mechanism of transcription[J]. Curr Opin Genet Dev, 2011, 21: 1-9.
https://dx.doi.org/10.1016/j.gde.2011.07.010
[8] Jia C. Kinetic foundation of the zero-inflated negative binomial model for single cell RNA sequencing data[J]. SIAM J Appl Math, 2020, 80: 1336-1355.
https://dx.doi.org/10.1137/19M1253198
[9] Munsky B, Fox Z, Neuert G. Integrating single-molecule experiments and discrete stochastic models to understand heterogeneous gene transcription dynamics[J]. Methods, 2015, 85: 12-21.
https://dx.doi.org/10.1016/j.ymeth.2015.06.009
[10] Cao Z, Grima R. Analytical distributions for detailed models of stochastic gene expression in eukaryotic cells[J]. Proc Natl Acad Sci, 2020, 117: 4682-4692.
https://dx.doi.org/10.1073/pnas.1910888117
[11] Cao Z, Grima R. Accuracy of parameter estimation for auto-regulatory transcriptional feedback loops from noisy data[J]. J R Soc Interface, 2019, 16: 20180967.
https://dx.doi.org/10.1098/rsif.2018.0967
[12] Chen L, Zhu C, Jiao F. A generalized moment-based method for estimating parameters of stochastic gene transcription[J]. Math Biosci, 2022, 345: 108780.
https://dx.doi.org/10.1016/j.mbs.2022.108780
[13] Jiao F, Sun Q, Tang M, et al. Distribution modes and their corresponding parameter regions in stochastic gene transcription[J]. SIAM J Appl Math, 2015, 6: 2396-2420.
https://dx.doi.org/10.1137/151005567
[14] Jiao F, Sun Q, Lin G, et al. Distribution profiles in gene transcription activated by cross-talking pathway[J]. Discrete Continuous Dyn Syst Ser B, 2019, 24: 2799-2810.
https://dx.doi.org/10.3934/dcdsb.2018275
[15] Iyer-Biswas S, Hayot F, Jayaprakash C. Stochasticity of gene products from transcriptional pulsing[J]. Phys Rev E, 2009, 79: 031911.
https://dx.doi.org/10.1103/PhysRevE.79.031911
[16] Chen L, Lin G, Jiao F. Using average transcription level to understand the regulation of stochastic gene activation[J]. Roy Soc Open Sci, 2022, 9: 211757.
https://dx.doi.org/10.1098/rsos.211757
[17] Jiao F, Tang M, Yu J. Distribution profiles and their dynamic transition in stochastic gene transcription[J]. J. Differential Equations, 2013, 254: 3307-3328.
https://dx.doi.org/10.1016/j.jde.2013.01.019
[18] Raj A, Peskin C S, Tranchina D, et al. Stochastic mRNA synthesis in mammalian cells[J]. PLoS Biol, 2006, 4: e309.
https://dx.doi.org/10.1371/journal.pbio.004030
(1. Basic Department, Guangdong Construction Polytechnic, Guangzhou, 510440, China
2. Guangzhou Center for Applied Mathematics, Guangzhou University, Guangzhou, 510006, China)
Abstract: Gene transcription is the central part of life process and has been a hot topic in life science research for many years. In this work, we discuss the dynamics of inactive genes in two conditions for telegraph model. We obtain the decaying dynamical distribution for the inactive genes. Furthermore, we find that the dynamical distribution is almost horizontal in the beginning region, if the synthesis rate is appropriately large. And we give some simulations to instruct the results. Keywords: Telegraph model; generating function; inactive gene; distribution.
Keywords: Telegraph model, generating function, inactive gene, distribution
DOI: 10.48014/fcpm.20221110001
Citation: ZHU Chunjuan, GUO Ying, LIANG Yiqi, et al. Dynamic distribution for inactive genes in telephone model[J]. Journal of Chinese Statistical Sciences, 2023, 1(1): 1-8.